Does an EL Image Measure a Panel's Annual Power Loss?
Quality Controleyerod · · 3 min read
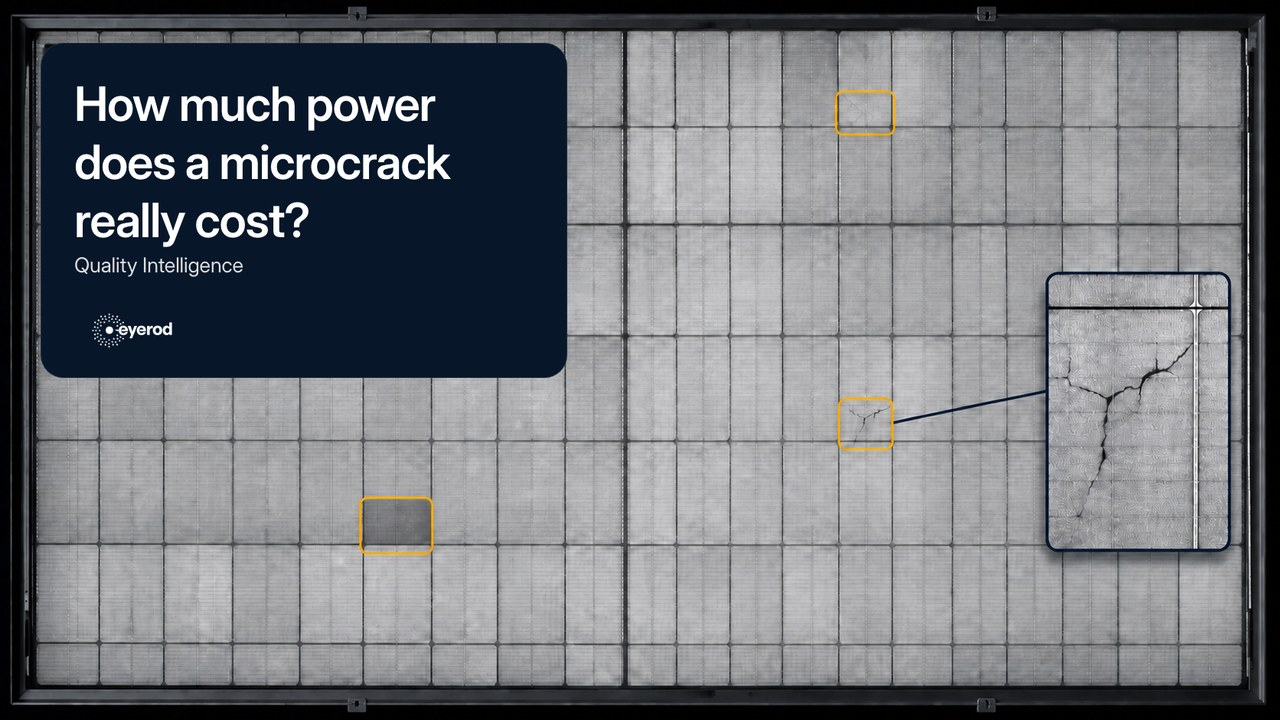
The power a PV module loses over time and the physical defect visible in that module are not the same thing. The two are often conflated: seeing a microcrack in an EL image does not mean the module’s annual degradation rate has been measured.
EL is a powerful imaging method that can make certain structural and interconnection defects visible at cell level. Assessing annual performance loss is a different exercise: it needs other measurement setups, suitable comparison conditions and a broader technical analysis.
What does degradation actually mean?
Degradation describes the change in a module’s electrical power over time. That change depends on module technology, climate, mounting, operating conditions, first-year effects and the measurement method itself. Quoting a single "annual loss" figure valid for all panels is therefore misleading.
Production changes seen at plant level are not caused by module degradation alone, either. Soiling, shading, equipment availability, inverter behaviour, the measurement chain and operating constraints all shape the production curve.
What does an EL image show?
An electroluminescence image captures the infrared light cells emit when current is applied to the module. Those images can provide cell-level evidence of microcracks, cell fractures, some interconnection problems and manufacturing defects.
But seeing a crack in the image does not on its own tell you how many watts it costs, or how much power the module will lose in the years ahead. The electrical impact of a defect has to be read together with its position in the cell, whether it is progressing, the module design and the operating conditions on site.
How is power loss actually assessed?
To examine a change in power quantitatively, teams use I-V curve measurement, flash testing, comparable performance data or other appropriate electrical tests. Which method is required depends on the type of problem, the warranty process and the project’s acceptance criteria.
EL does not replace those assessments. Its proper role, particularly during manufacturing or acceptance, is to provide additional evidence where a physical defect is suspected.
Why doesn’t the warranty curve match field results?
A module power warranty defines the manufacturer’s commitment under specified conditions. Actual energy production on site is shaped by irradiance, temperature, soiling, shading, system design and operating conditions. Reading the warranty curve as a direct prediction of field production is therefore a mistake.
The evidence set a warranty or acceptance process requires also varies by contract. An EL image can be a valuable piece of it, but on its own it does not amount to a sufficient technical file for every claim. For how that file is assembled, see documenting defects for a warranty claim.
What is eyerod’s role?
eyerod Quality Intelligence analyzes EL images captured at the factory with AI, supporting the classification of microcracks, structural defects and manufacturing fault patterns. eyerod does not capture EL images, and does not perform flash tests, I-V measurements or degradation-rate calculations.
That boundary matters. EL analysis can deliver an earlier, more structured assessment of module quality and defects. It should be used for its proper role in the evidence chain behind a decision, rather than presented as a "degradation measurement".
Conclusion
An EL image makes certain physical defects in panels visible; it does not measure annual power loss. A sound technical decision reads the finding in the image together with electrical measurements, site context and the acceptance criteria in the contract. For how microcracks can be handled, see microcracks in solar panels.
Frequently asked questions
Does an EL image give a panel’s annual degradation rate?
It does not. EL makes microcracks, cell fractures and some interconnection defects visible at cell level. Assessing annual power loss requires other measurement setups, suitable comparison conditions and a broader technical analysis.
How many watts does a microcrack in an EL image cost?
That cannot be determined from the image alone. The electrical impact of a defect is assessed together with its position in the cell, whether it is progressing, the module design and the operating conditions on site, with I-V curve measurement or a flash test where required.
Does the module power warranty curve predict field production?
It does not. A power warranty defines the manufacturer’s commitment under specified conditions. Actual production on site is shaped by irradiance, temperature, soiling, shading, system design and operating conditions.
Which Heat Findings Does Thermal Inspection Make Visible at a Solar Plant?